Skip to content

Weather Data Platform

Weather Infrastructure for Your Applications

Ingest any weather data. Serve it through a high-performance API.

Build dashboards, mobile apps, or AI agents — we handle the pipeline from GRIB2 ingestion to sub-second point queries, so you can ship product instead of plumbing.

Scroll to explore

Building weather into your product is harder than it should be.

Data Complexity

GRIB2 files, irregular grids, model runs, forecast steps — raw weather data wasn't designed for application developers.

Infrastructure Burden

Stand up ingestion pipelines, storage backends, coordinate systems, and interpolation engines before you can serve a single data point.

Time to Market

Months building infrastructure instead of building your product. Every weather startup solves the same plumbing problems.

The Platform

From raw data to deployed product.

Three layers, fully integrated. Use any one — or the whole stack.

01

Ingest

Bring your data — or use ours.

  • NOAA models built in (GFS, HRRR)
  • Upload custom GRIB2 models
  • Derived fields computed automatically
  • Continuous downloads with backfill
02

Serve

Query via API in milliseconds.

  • Point queries with interpolation
  • Timeseries forecasts
  • Route weather along a path
  • Tile overlays for map UIs
03

Build

SDKs and tools for any stack.

  • Python and TypeScript SDKs
  • React component library
  • REST + MessagePack API
  • MCP server for AI agents

See It Live

This dashboard is running against our API right now.

Every component below is from @stormlore/react, pulling live forecast data from Storm Glass.

Current Conditions

Loading live data...

48-hour Forecast

Loading live data...

Interactive Weather Map

Loading live data...

Built With Us

See what's possible when you don't have to build the plumbing.

Built With Us — Case Study

Storm Warden

Route weather intelligence for truckers and travelers

A mobile app built entirely on the platform. Route-aware forecasts, NWS alerts, customizable impact thresholds, and advanced wind analysis — shipped without building any of the data plumbing.

Route Weather

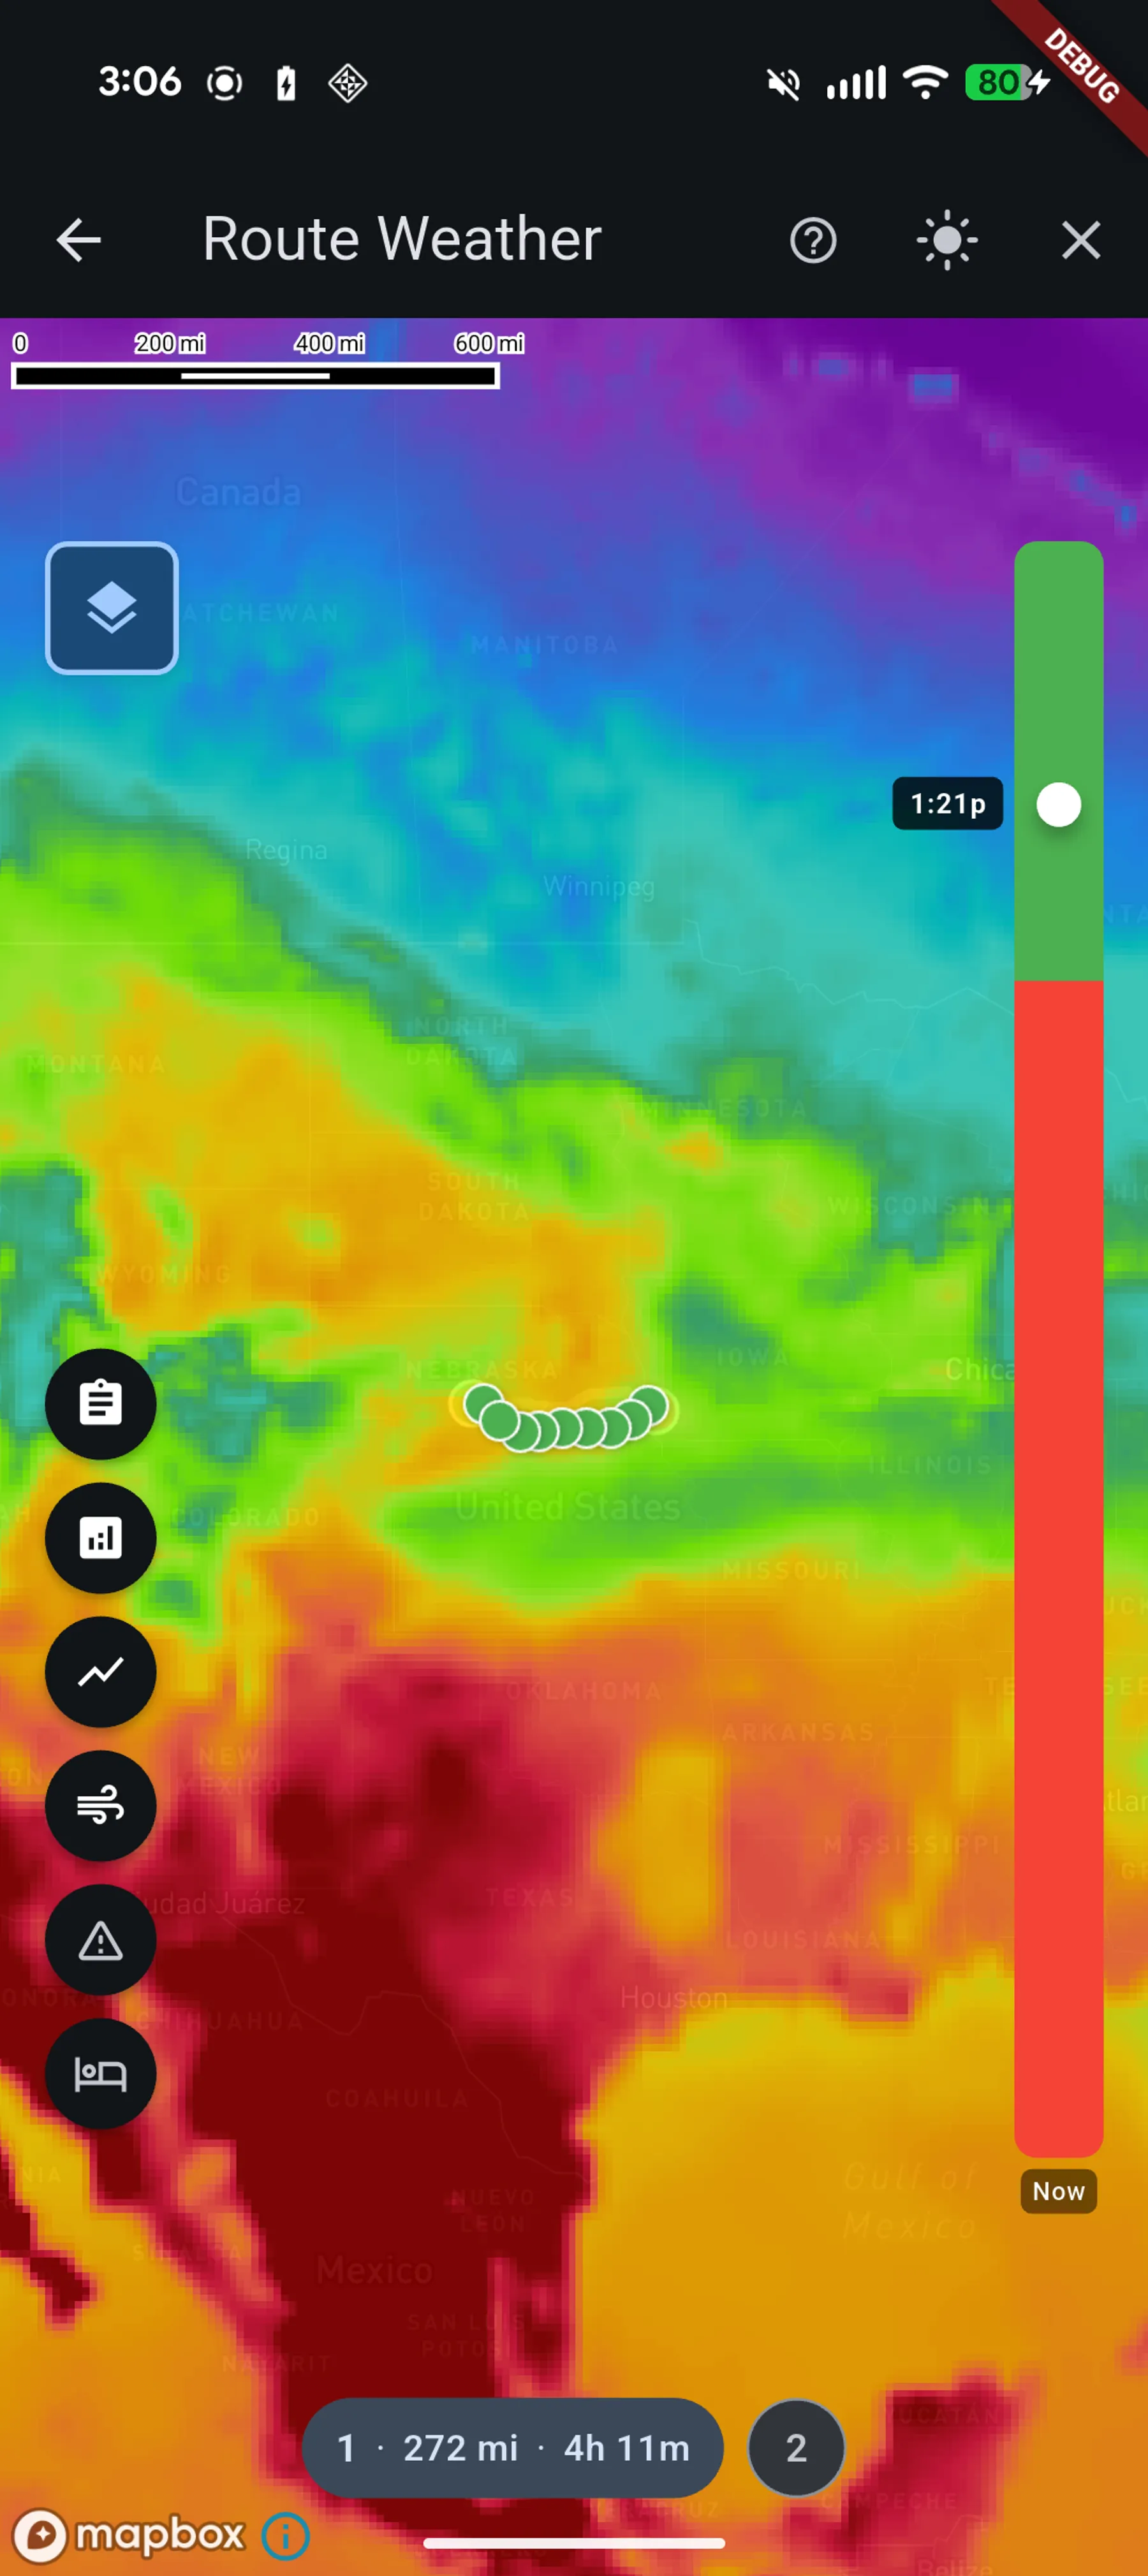
Plan a route and see exactly what weather you'll encounter at every point along the way, at the time you'll actually be there.

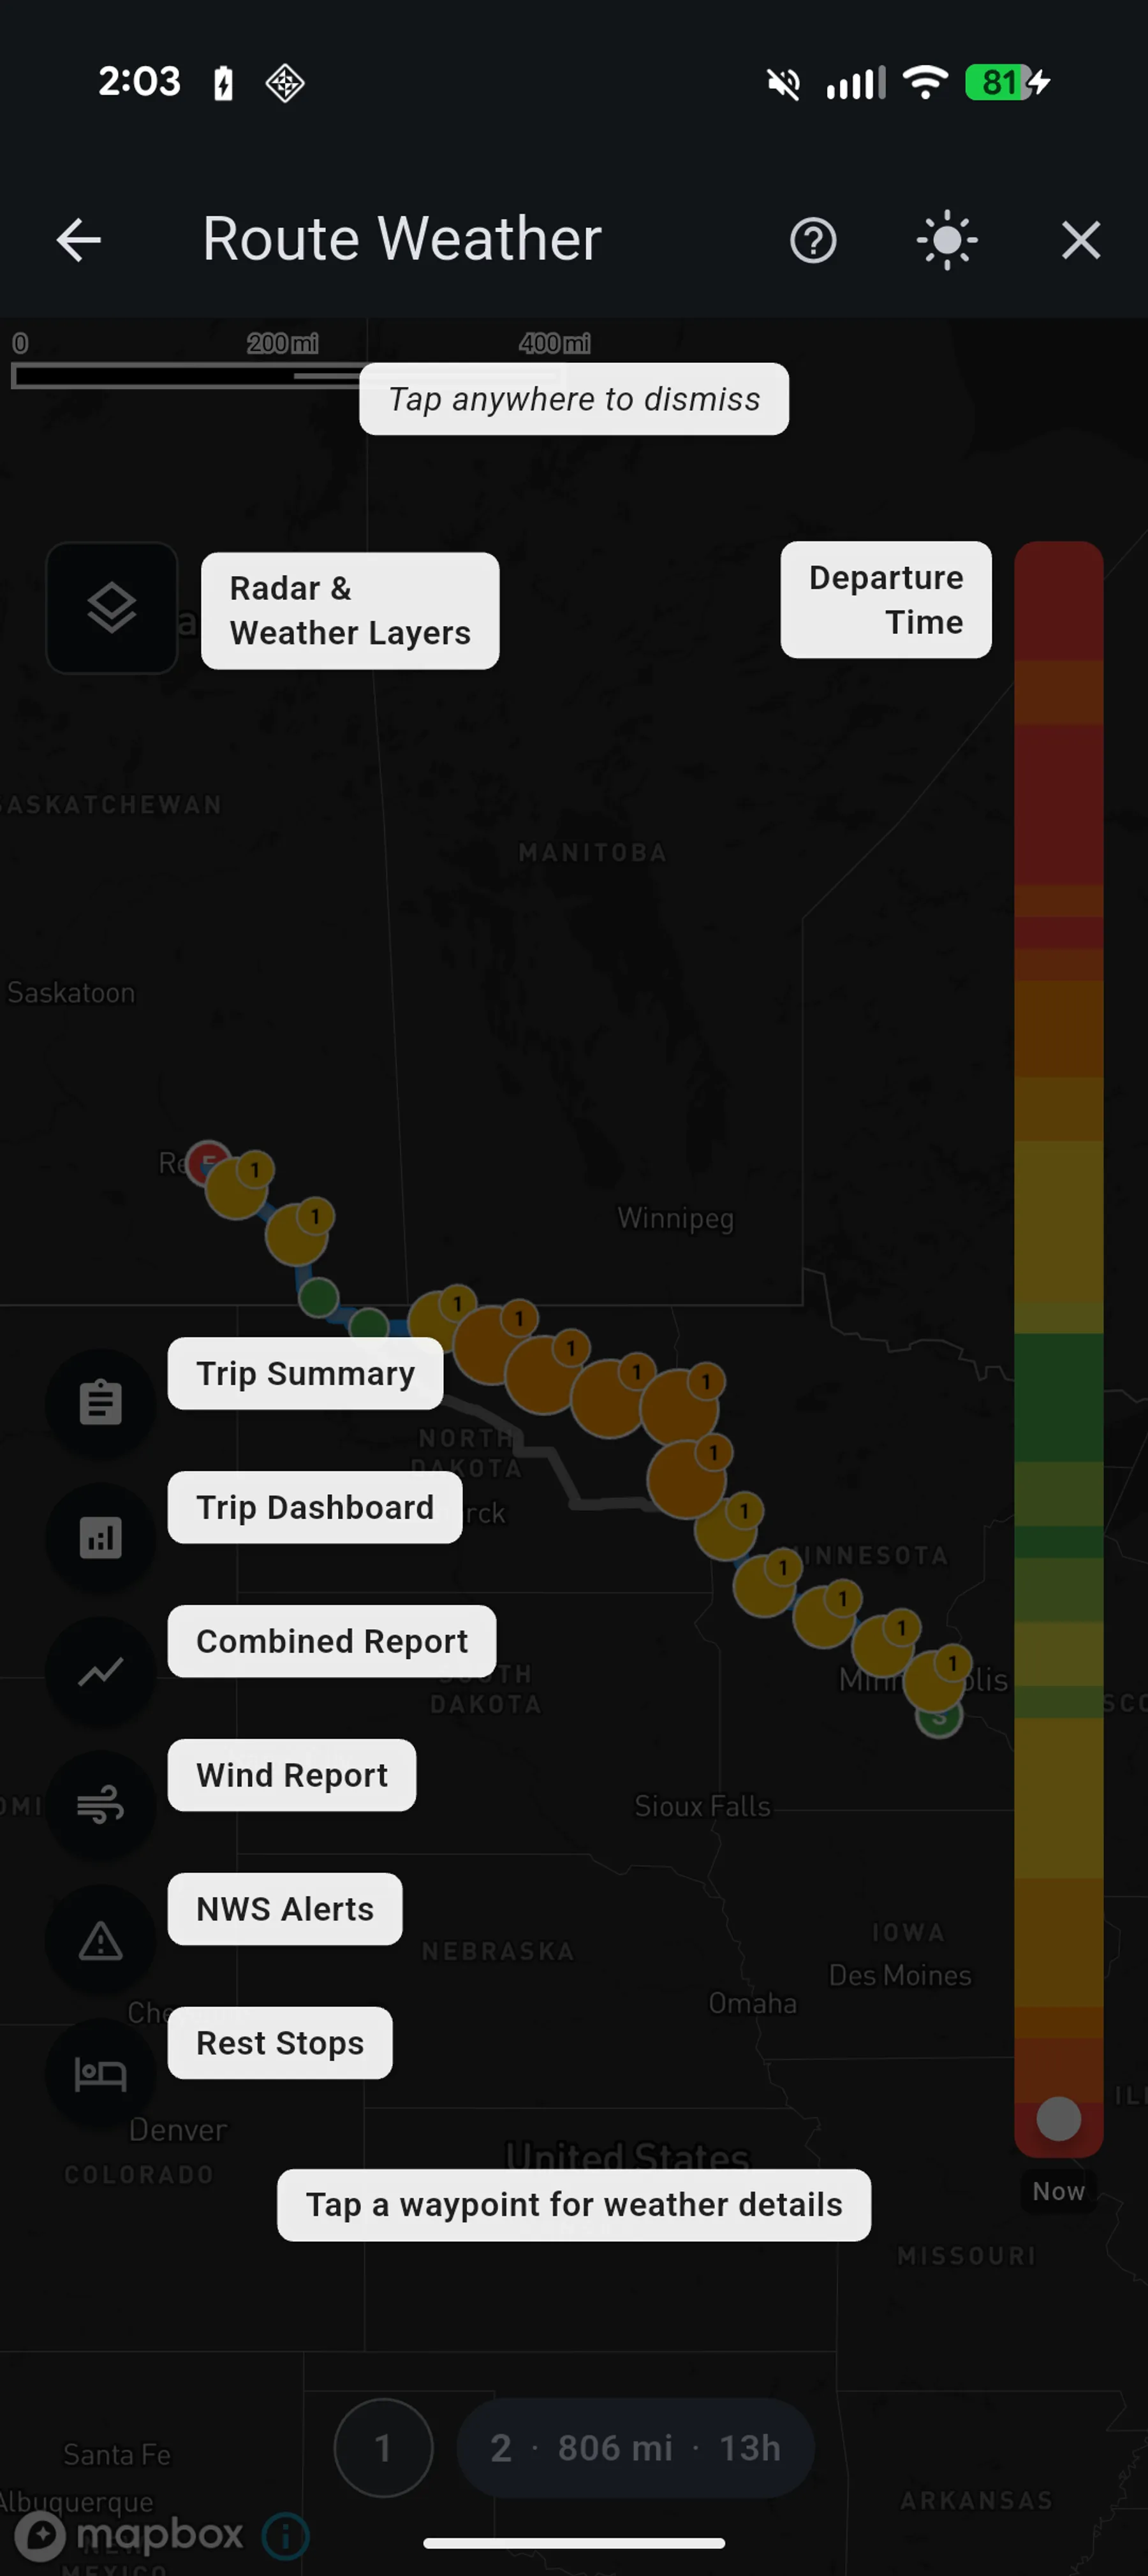
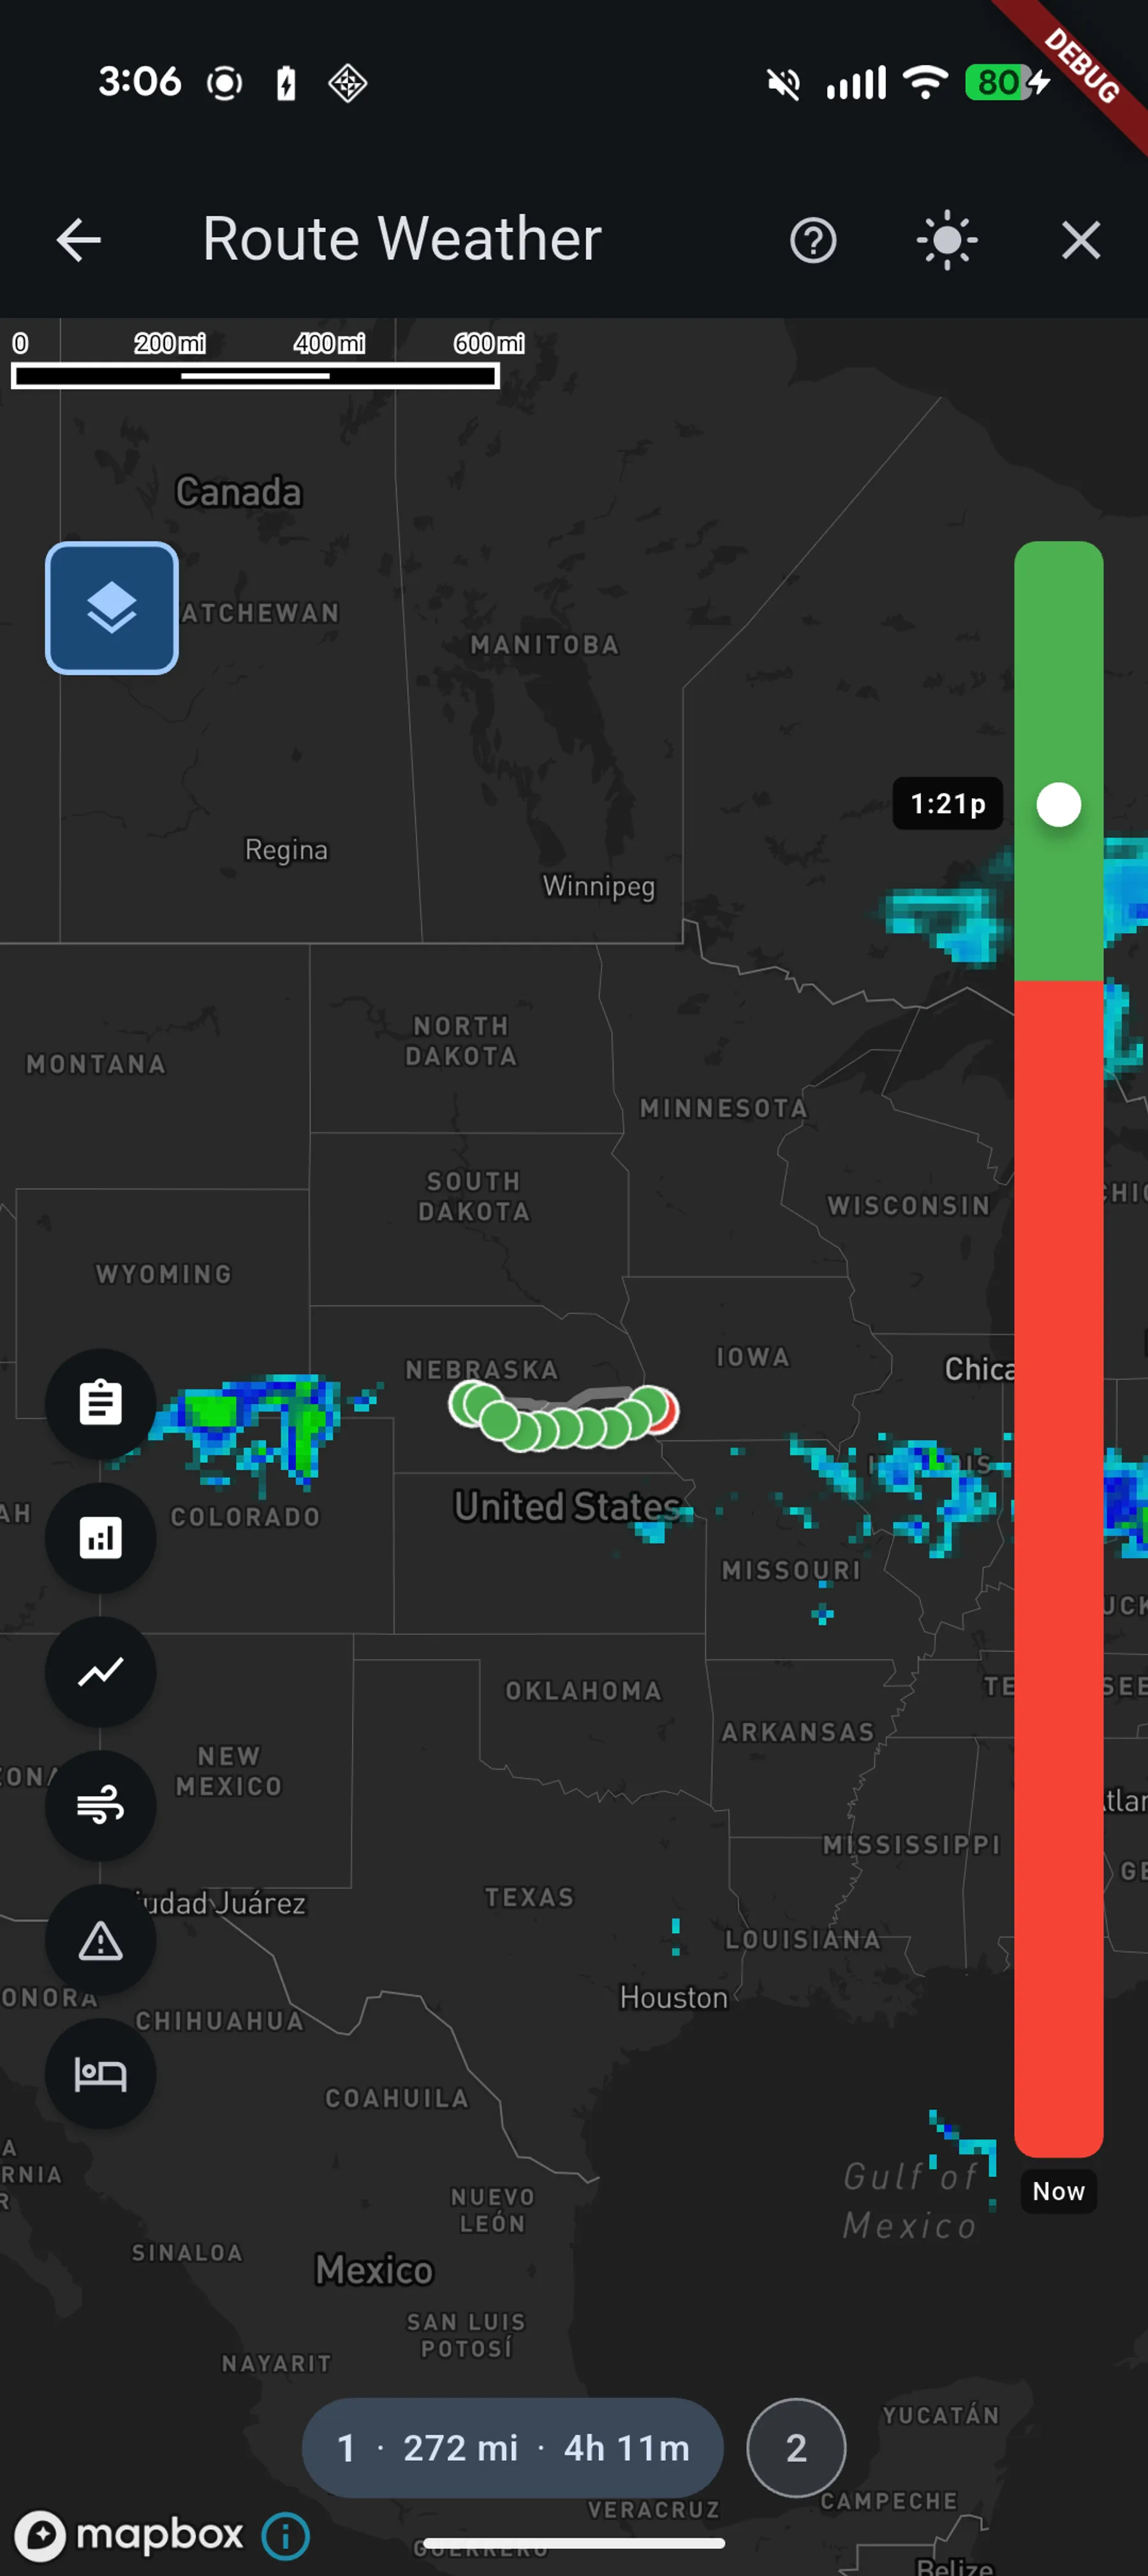
The flagship feature of Storm Warden. Tap the map to set start and end points, and Storm Warden calculates the route with weather waypoints along it — each timestamped to your estimated arrival time. A vertical departure time slider lets you explore up to 12 hours into the future, with a severity heatmap showing which departure times have the worst conditions at a glance.

  • Tap-to-plan routing with time-stamped weather at every waypoint
  • Departure time slider with severity heatmap for optimal timing
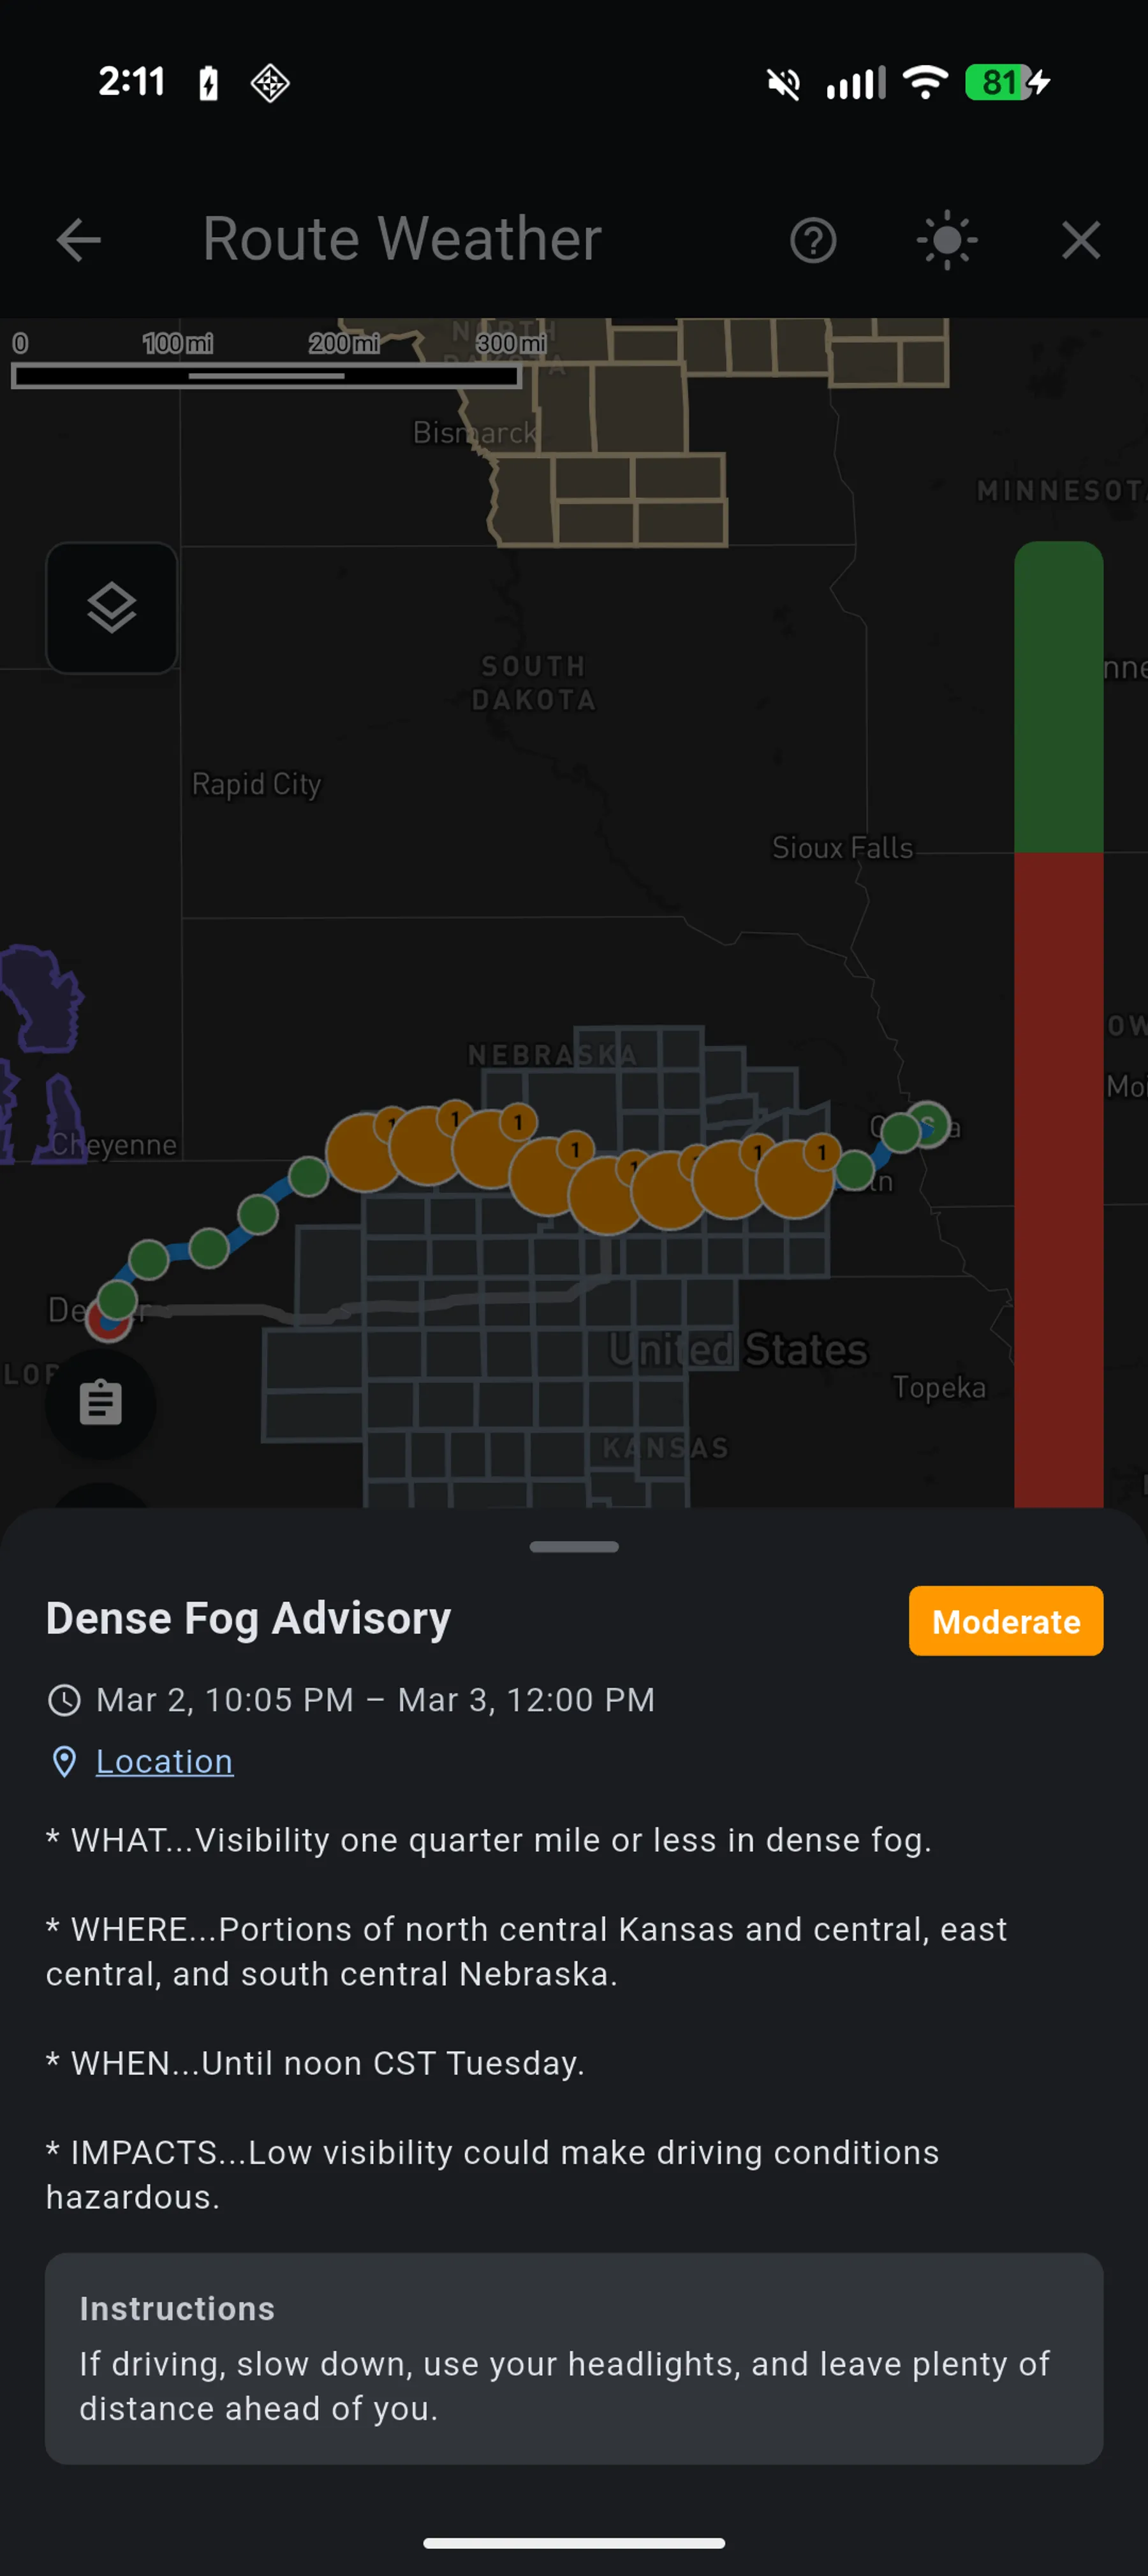
  • Color-coded waypoint markers showing condition severity (green to red)
  • Alternate route comparison with animated expand/collapse
  • Map and timeline toggle views for different presentation styles

Rest Stops

Model real-world breaks along your route and have all weather forecasts shift to match your actual arrival times.

Toggle rest stop mode and tap anywhere along your route to add a break. Set durations from 15 minutes to 12 hours. Each rest stop pushes all downstream waypoint arrival times forward, triggering a full weather recalculation so forecasts, NWS alerts, and the departure heatmap all reflect when you'll actually be at each location.

  • Tap-to-place rest stops snapped to the route geometry
  • Duration picker from 15 minutes to 12 hours
  • Cumulative delay propagation — multiple stops stack correctly
  • Full weather recalculation with adjusted arrival times

Trip Summary

A single-screen go/no-go briefing that distills everything Storm Warden knows about your route.

The pre-trip briefing provides a color-coded overall trip verdict (green to red), optimal departure time recommendation, key hazard identification, NWS alert summary, wind efficiency analysis, and a segment-by-segment breakdown of conditions along the route. All computed from existing data with zero additional API calls.

  • Overall trip verdict with worst-condition identification
  • Best departure time recommendation from heatmap data
  • Top hazards ranked by severity with location markers
  • Segment breakdown using hybrid severity-transition algorithm
  • Zero API calls — operates on already-fetched route data
Trip Summary

NWS Weather Alerts

Real-time National Weather Service alert integration across routes and watch points.

Active NWS alerts are rendered as colored polygon overlays directly on the map using the official NWS event color palette (75+ event types). Time-aware filtering updates alert visibility in ~1ms as you move the departure slider. A bundled binary file maps ~7,800 zone codes to polygon coordinates via O(log n) binary search, with non-blocking architecture so weather data always loads even if alerts are unavailable.

  • Alert polygon overlays with official NWS color palette
  • GPU-side time filtering — ~1ms updates when departure time changes
  • Per-waypoint alert chips on the timeline view
  • Alert detail sheets with full NWS descriptions and instructions
  • Bundled zone-to-polygon binary for offline alert geometry
NWS Weather Alerts

Wind Report

A dedicated full-screen wind analysis tool with five visualization modes.

Five specialized views rendered over a static map snapshot for battery efficiency: Overview (severity circles with direction arrows), Fuel Efficiency (drag multiplier coloring), Headwind (strong headwind segments), Crosswind (dangerous crosswind highlighting), and Animated (real-time GPU-rendered particle field showing actual wind flow). The map snapshot approach kills the GL surface entirely and uses a pure-Dart affine projection for all rendering.

  • Five visualization modes: Overview, Fuel Efficiency, Headwind, Crosswind, Animated
  • Animated particle field showing real wind flow from weather model data
  • Battery-optimized: captures map snapshot, kills GL surface
  • Pure-Dart affine geo-to-screen projection without platform channel calls
  • Per-mode info and summary modals for detailed wind conditions

Trip Weather Dashboard

A comprehensive chart-based view of all weather conditions along the route.

All enabled weather parameters plotted on a single band-relative chart where the Y-axis is divided into four severity zones (green, advisory, warning, severe) so different parameter types can be compared on the same visual scale. An interactive crosshair with tooltip shows exact values at any point, synchronized with an embedded route map and compound impact strips.

  • Combined multi-parameter chart with severity-banded Y-axis
  • Interactive crosshair with sorted parameter tooltip
  • Synchronized embedded route map tracking chart position
  • Compound impact strips showing where combined conditions trigger
  • Renders from pre-fetched route data — no additional API calls
Trip Weather Dashboard

Watch Points

Save and monitor up to 10 geographic locations for ongoing weather awareness.

Each watch point shows real-time current conditions with severity indicators plus a horizontal 24-hour forecast timeline. Active NWS alerts are displayed per watch point with a highest-severity summary badge. Context templates (default, farm, house) provide customized display, and progressive loading shows cached conditions instantly while forecasts load in the background.

  • Current conditions plus 24-hour forecast timeline per location
  • NWS alert cards with expandable descriptions and instructions
  • Context templates for different location types
  • Map view of all watch points with severity-colored markers
  • Sort by name, creation date, or distance from current location
Watch Points
Watch Points

Impact Configurator

Define what weather conditions matter to you with fully customizable thresholds.

Set three severity thresholds (Advisory, Warning, Severe) for every weather parameter. Bidirectional parameters like temperature support both cold and heat thresholds independently — the UI renders a single slider with six thumbs and a green "normal" zone in the middle. Create compound impact rules that trigger when multiple conditions are met simultaneously, using weakest-link severity logic.

  • Customizable thresholds for all weather parameters
  • Bidirectional sliders for temperature (cold + heat thresholds)
  • Compound impact rules with AND-logic multi-parameter triggers
  • Three severity levels: Advisory (yellow), Warning (orange), Severe (red)
  • Derived parameters: headwind, crosswind, drag multiplier, fuel efficiency
Impact Configurator

Tile Overlays

Weather radar and model data rendered as map tile layers with smooth transitions.

The middleware serves 256x256 greyscale PNG tiles with weather data encoded as pixel values. Client-side Mapbox expressions transform greyscale to color using parameter-specific color ramps. Double-buffered A/B layer transitions with crossfade animation prevent flicker when switching departure times or parameters. Tiles render below roads and labels but above terrain, keeping geographic context visible.

  • Colorized raster tiles with parameter-specific color ramps
  • Double-buffered A/B layer transitions with crossfade animation
  • Client-side greyscale-to-color transformation via Mapbox expressions
  • Layer ordering preserves roads, labels, and state boundaries
  • Smooth parameter and departure time switching without flicker
Tile Overlays
Tile Overlays

How It Works

One pipeline, four stages.

You own the ends. We handle the middle.

Stage 01

Your Data

Source

  • GRIB2
  • CSV
  • NetCDF
  • NOAA models

Stage 02

Stormgard

Ingest & Process

  • Download
  • Convert
  • Derive fields
  • Store in Zarr

Stage 03

Storm Glass API

Serve

  • REST + Tiles
  • JSON + MsgPack
  • Sub-second queries

Stage 04

Your Application

Build

  • React / Python
  • Mobile / Web
  • AI / MCP

Ready to Build?

Two npm packages — a pure TypeScript client and a React component library — and you're querying live forecasts.

npm install @stormlore/client @stormlore/react